The U.S. Department of Transportation (DOT) has released its December 2019 Air Travel Consumer Report (ATCR) on reporting marketing and operating air carrier data compiled for the month of October 2019. The full consumer report and other aviation consumer matters of interest to the public can be found at http://www.transportation.gov/airconsumer.

October On-Time Performance
In October 2019, reporting marketing carriers posted an on-time arrival rate of 82.2%, down from the 84.1% on-time rate in September 2019 and down slightly from 82.3% in October 2018.
For the first 10 months of 2019, the reporting marketing carriers posted an on-time arrival rate of 78.5%, down slightly from 78.7% for the same period in 2018.
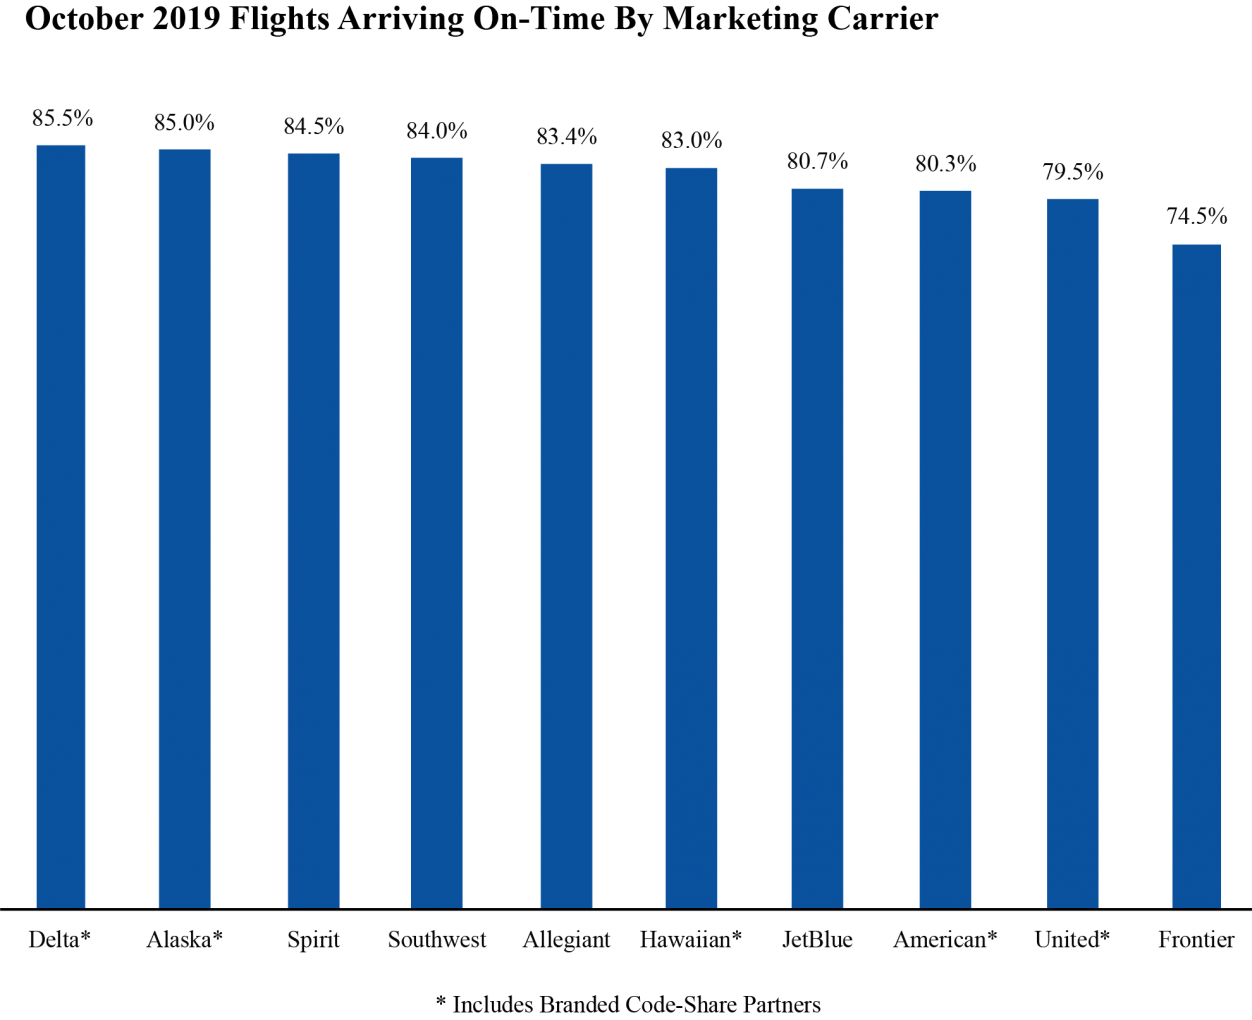
Highest Reporting Marketing Carrier On-Time Arrival Rates (ATCR Table 1)
- Delta Air Lines Network – 85.5%
- Alaska Airlines Network – 85.0%
- Spirit Airlines – 84.5%
Lowest Reporting Marketing Carrier On-Time Arrival Rates (ATCR Table 1)
- Frontier Airlines – 74.5%
- United Airlines Network – 79.5%
- American Airlines Network – 80.3%
October Cancellations
In October 2019, reporting marketing carriers canceled 0.9% of their scheduled domestic flights, lower than the rate of 1.7% in September 2019, but slightly higher than the rate of 0.8% in October 2018.
Lowest Reporting Marketing Carrier Rates of Canceled Flights (ATCR Table 6)
- Allegiant Air – 0.1%
- Delta Air Lines Network – 0.1%
- JetBlue Airways – 0.4%
Highest Reporting Marketing Carrier Rates of Canceled Flights (ATCR Table 6)
- Frontier Airlines – 1.5%
- American Airlines Network – 1.3%
- Southwest Airlines – 1.2%
Tarmac Delays
In October 2019, airlines reported five tarmac delays of more than three hours on domestic flights, compared to 11 such tarmac delays reported in September 2019 and two tarmac delays reported in October 2018. In October 2019, airlines reported no tarmac delays of more than four hours on international flights, compared to no tarmac delays reported in September 2019 and one tarmac delay reported in October 2018. Extended tarmac delays are investigated by the Department.
Domestic Flights with Longest Tarmac Delays Exceeding Three Hours (ATCR Table 8)
- United Airlines flight 5300 (operated by SkyWest Airlines) from Denver (DEN) to Bozeman, Mont. (BZN), 10/10/19 – delayed 3 hours and 31 minutes on the Denver tarmac.
- JetBlue Airways flight 1374 from Charleston, S.C. (CHS) to New York JFK (JFK), 10/17/19 – delayed 3 hours and 28 minutes on the tarmac at Philadelphia (PHL) after being diverted.
- Alaska Airlines flight 1171 from Denver (DEN) to Seattle, Wash. (SEA), 10/28/19 – delayed 3 hours and 7 minutes on the Denver tarmac.
International Flights with Longest Tarmac Delays Exceeding Four Hours (ATCR Table 8A)
There were no tarmac delays of more than four hours on international flights in October.
Mishandled Baggage
In October 2019, the reporting marketing carriers posted a mishandled baggage rate of 4.77 mishandled bags per 1,000 checked bags, a slightly higher rate than the September 2019 rate of 4.70 per 1,000 checked bags.
See the December 2019 Air Travel Consumer Report for mishandled baggage numbers by airline.
Mishandled Wheelchairs and Scooters
In October 2019, reporting marketing airlines reported checking 70,976 wheelchairs and scooters and mishandling 913, a rate of 1.29% mishandled, compared to the rate of 1.32% mishandled in September 2019. In December 2018, DOT reported mishandled wheelchairs and scooters data for carriers for the first time.
See the December 2019 Air Travel Consumer Report for mishandled wheelchair and scooter numbers by airline.
Bumping/Oversales
Bumping/oversales data, unlike other air carrier data, are reported quarterly rather than monthly. Third quarter 2019 bumping/oversales data were released in the November 2019 Air Travel Consumer Report. Full year 2019 and fourth quarter 2019 bumping/oversales data will be available in the February 2020 Air Travel Consumer Report.
See the November 2019 Air Travel Consumer Report for denied boarding numbers by airline.
Incidents Involving Animals
In October 2019, U.S. airlines reported zero incidents involving the death, injury, or loss of an animal while traveling by air, equal to the October 2018 report, and down from the three filed in September 2019.
Complaints About Airline Service
In October 2019, DOT received 1,139 complaints about airline service from consumers, down 8.5% from the total of 1,245 filed in October 2018 and down 9.5% from the 1,258 received in September 2019.
Complaints About Treatment of Disabled Passengers
In October 2019, the Department received a total of 77 disability-related complaints, up from both the 67 complaints received in October 2018, and the 66 complaints received in September 2019.
Complaints About Discrimination
In October 2019, the Department received nine complaints alleging discrimination – six regarding race, two regarding ancestry/ethnicity, and one regarding national origin. This is down from both the 10 complaints recorded in October 2018, and the 12 complaints received in September 2019.
All complaints alleging discrimination are investigated to determine if there has been a violation(s) of the passenger’s civil rights.


Bulloch Public Safety
07/22/2026 Booking Report for Bulloch County

Bulloch Public Safety
07/21/2026 Booking Report for Bulloch County

Chattooga Local News
Trump Returns to Georgia

Bulloch Public Safety
07/17/2026 Booking Report for Bulloch County
Bulloch Public Safety
07/13/2026 Booking Report for Bulloch County
Bulloch Public Safety
07/06/2026 Booking Report for Bulloch County
Bulloch Public Safety
07/01/2026 Booking Report for Bulloch County
Bulloch Public Safety
06/22/2026 Booking Report for Bulloch County