Statistics show that between 1991 and 2017, the rate of drunk driving fatalities per 100,000 people decreased by nearly 50% and for drivers 21 and younger, that rate decreased by 68%. Even still, preventable fatal accidents involving alcohol still remain a problem in all corners of the nation.

But which states have the worst statistics?
Analysts with Butler Wooten Peak recently analyzed fatal crash records of more than 34,000 wrecks using data from the National Highway Transportation Safety Administration for the 2018 year – the most recent year with data available. After narrowing those wrecks based on whether or not alcohol was a factor, the group found that nearly 25% of all fatal crashes in 2018 involved the use of alcohol.
It’s also worth noting that, in 2017, nearly 2,000 people died in alcohol-related traffic accidents in which the driver was less-impaired than the established blood-alcohol content limit.
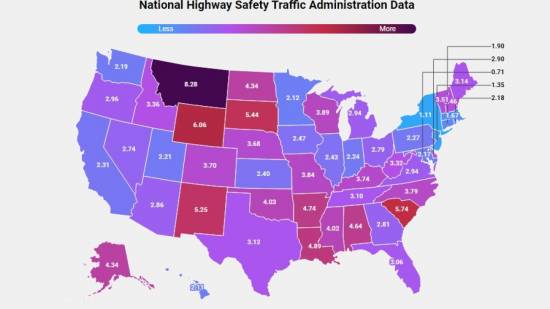
Montana, Wyoming, and South Carolina ranked as the worst of the worst when considering rates per 100,000.
| State | Fatals 2018 | Rate 2018 | Fatals 2017 | Rate 2017 | Rate Change |
| MONTANA | 88 | 8.28 | 72 | 6.78 | 22.22% |
| WYOMING | 35 | 6.06 | 43 | 7.44 | -18.60% |
| SOUTH CAROLINA | 292 | 5.74 | 329 | 6.47 | -11.25% |
The District of Columbia is at the bottom, with just 0.77 fatalities per 100,000, followed by New York with a 1.11 rate, likely in large part to the use of public transportation, taxi services, and ridesharing.
| NEW JERSEY | 120 | 1.35 | 134 | 1.50 | -10.45% |
| NEW YORK | 217 | 1.11 | 188 | 0.96 | 15.43% |
| DISTRICT OF COLUMBIA | 5 | 0.71 | 14 | 1.99 | -64.29% |
The Peach State ranked 15th out of 51. 2018 showed 296 fatal crashes in which alcohol was a factor – a -7.21% reduction from 2017. The numbers means alcohol-related fatal crashes occur at a rate of 2.81 crashes per 100,000 people.
Among the findings, the report found:
- Overall, alcohol-involved crash fatality rates have decreased from that of the previous year.
- Only 13 states reported an increase in rates from 2017 to 2018.
- Washington, D.C. saw the largest rate decrease in the nation with a 64.29% decrease in alcohol-involved crash fatalities per capita.
- New Hampshire saw the largest rate increase in the nation, and the most dramatic change on the list, with a 74.07% increase. This increase in alcohol-involved crash fatalities is enough to take New Hampshire from the bottom ten in 2017 to 20th place in 2018.
In late 2019, research published by Siegfried & Jensen revealed that while Georgia had some of the strictest DUI laws in the nation, more stringent DUI laws do not necessarily equate to fewer repeat offenders. The Peach State ranked third in the nation for strictest DUI laws.
The map below compares drunk driving fatality rates per 100,000 people in the population for each state in the United States and the District of Columbia, ranking them from highest to lowest.
With the interactive map, you can hover over any state to see the corresponding drunk driving fatality rate, along with its current ranking from 1-51 (1 being the highest (worst) fatality rate and 51 being the lowest (best) rate).
Map created by Butler Wooten Peak.
1 Comment
Leave a Reply
Leave a Reply


Bulloch Public Safety
07/22/2026 Booking Report for Bulloch County

Bulloch Public Safety
07/21/2026 Booking Report for Bulloch County

Chattooga Local News
Trump Returns to Georgia
Bulloch Public Safety
07/17/2026 Booking Report for Bulloch County
Bulloch Public Safety
07/13/2026 Booking Report for Bulloch County
Bulloch Public Safety
07/06/2026 Booking Report for Bulloch County
Bulloch Public Safety
07/01/2026 Booking Report for Bulloch County
Bulloch Public Safety
07/20/2026 Booking Report for Bulloch County
Lauren Kunis
October 22, 2020 at 10:12 am
Even though people already know about DUI accidents, some might still do it. This is really a huge problem when you’re involved in a DUI case, it will cost you a lot or this could end your life. I hope people should go on treatment if they’re really dependent on it or might enroll in an online DUI class to prevent DUI problems.