
Obesity is an ever growing problem in America.

The Centers for Disease Control and Prevention (CDC) reports that more than 42% of American adults are obese – a rate that has doubled in the past 20 years and has nearly tripled over the past 50 years.
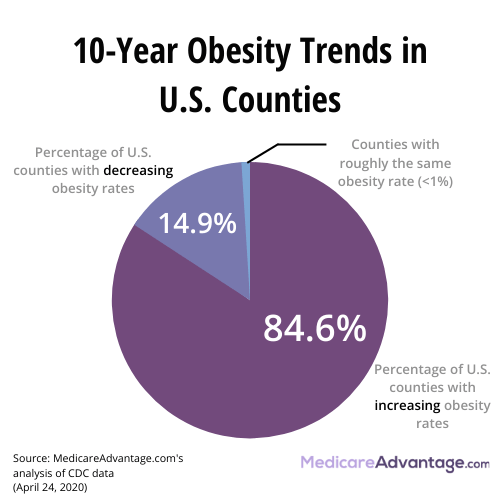
Across the country, 2,651 – or 84.6% of- U.S. counties experienced a 10-year increase in obesity rates while just 466 counties (14.9%) saw a decrease in obesity rates.
More recently, MedicareAdvantage.com conducted a study by analyzing the most recent data from the Diabetes Surveillance System for the purposes of looking at trends for counties over the last decade.
The Peach State didn’t fare too well.
Among the findings:
- Aside from having the largest 10-year increase in obesity rates from 2006-2016 in the U.S. (+26.6%), Warren County also had the highest rate of obesity in the nation in 2016 (57.9%).
- Georgia is home to seven of the 22 counties in the U.S. with the most drastic 10-year increase in obesity rates.
- The state of Georgia lays claim to three of the top 11 counties for improved (decreased) rates of obesity.
- Nearly 85% of U.S. counties experienced a 10-year increase in obesity rates
| County | State | 2006 Percentage of Residents With Obesity | 2016 Percentage of Residents With Obesity | 10-Year Change (Percentage Points) | National Rank |
|---|---|---|---|---|---|
| Issaquena County | MS | 39 | 26.9 | -12.1 | 1 |
| West Feliciana Parish | LA | 32.7 | 21.1 | -11.6 | 2 |
| Dent County | MO | 32.5 | 21 | -11.5 | 3 |
| Greene County | AL | 45.6 | 35.4 | -10.2 | 4 |
| Iron County | MO | 33.8 | 24 | -9.8 | 5 |
| Lincoln County | GA | 33.2 | 23.5 | -9.7 | 6 |
| Mcduffie County | GA | 33.2 | 23.7 | -9.5 | 7 |
| Lake County | MI | 35.5 | 26.2 | -9.3 | 8 |
| Franklin County | MS | 41 | 31.7 | -9.3 | 9 |
| Jefferson County | GA | 37.2 | 28.6 | -8.6 | 10 |
| Gosper County | NE | 32.1 | 23.7 | -8.4 | 11 |
| Mercer County | MO | 30.9 | 22.6 | -8.3 | 12 |
| Dickinson County | MI | 31.6 | 23.4 | -8.2 | 13 |
| Cottle County | TX | 28.9 | 20.7 | -8.2 | 14 |
| Greene County | NC | 36.1 | 28.1 | -8 | 15 |
| Falls Church City | VA | 26.4 | 18.4 | -8 | 16 |
| Ozark County | MO | 31.1 | 23.2 | -7.9 | 17 |
| Clay County | IL | 29.9 | 22.1 | -7.8 | 18 |
| Miller County | GA | 31 | 23.4 | -7.6 | 19 |
| Stewart County | TN | 33.2 | 25.7 | -7.5 | 20 |
| Trousdale County | TN | 29.7 | 22.2 | -7.5 | 21 |
| Camden County | MO | 29.4 | 22 | -7.4 | 22 |
| Lexington City | VA | 27.7 | 20.3 | -7.4 | 23 |
| Bowman County | ND | 29.6 | 22.4 | -7.2 | 24 |
| Webster County | GA | 32.4 | 25.2 | -7.2 | 25 |
| County | State | 2006 Percentage of Residents With Obesity | 2016 Percentage of Residents With Obesity | 10-Year Change (Percentage Points) | National Rank |
|---|---|---|---|---|---|
| Warren County | GA | 31.3 | 57.9 | 26.6 | 1 |
| King And Queen County | VA | 28.6 | 53.1 | 24.5 | 2 |
| Clinch County | GA | 29.5 | 52.4 | 22.9 | 3 |
| Worth County | GA | 30 | 51.7 | 21.7 | 4 |
| Toombs County | GA | 27.4 | 48.6 | 21.2 | 5 |
| Pecos County | TX | 25.3 | 46.4 | 21.1 | 6 |
| Daviess County | MO | 26 | 46.3 | 20.3 | 7 |
| Franklin County | IA | 26.7 | 46.8 | 20.1 | 8 |
| Candler County | GA | 31.1 | 50.2 | 19.1 | 9 |
| Aleutians East Borough | AK | 30.8 | 49.9 | 19.1 | 10 |
| Colusa County | CA | 21.8 | 40.6 | 18.8 | 11 |
| Bowie County | TX | 29.3 | 47.7 | 18.4 | 12 |
| Frontier County | NE | 26.9 | 44.9 | 18 | 13 |
| Grant Parish | LA | 29.9 | 47.6 | 17.7 | 14 |
| Appomattox County | VA | 30.8 | 48.4 | 17.6 | 15 |
| Aleutians West Census Area | AK | 26.6 | 44.1 | 17.5 | 16 |
| Owsley County | KY | 30.4 | 47.6 | 17.2 | 17 |
| Lassen County | CA | 23.7 | 40.9 | 17.2 | 18 |
| Logan County | CO | 21.3 | 38.2 | 16.9 | 19 |
| Lee County | GA | 27 | 43.9 | 16.9 | 20 |
| Sevier County | TN | 28.1 | 45 | 16.9 | 21 |
| Crawford County | GA | 29.8 | 46.4 | 16.6 | 22 |
| Armstrong County | PA | 26.9 | 43.2 | 16.3 | 23 |
| Okfuskee County | OK | 32.5 | 48.8 | 16.3 | 24 |
| Coryell County | TX | 25.9 | 42.1 | 16.2 | 25 |
In April 2020, MedicareAdvantage.com reported that obesity is one of the top underlying conditions for people who have complications and are hospitalized with COVID-19, second only to hypertension in people aged 18-64.


Bulloch Public Safety
07/28/2026 Booking Report for Bulloch County

Chattooga Local News
Gov. Kemp Announces 44 Appointments to Boards, Authorities, and Commissions


Bulloch Public Safety
07/27/2026 Booking Report for Bulloch County
Bulloch Public Safety
07/17/2026 Booking Report for Bulloch County
Bulloch Public Safety
07/13/2026 Booking Report for Bulloch County
Bulloch Public Safety
07/06/2026 Booking Report for Bulloch County
Bulloch Public Safety
07/20/2026 Booking Report for Bulloch County