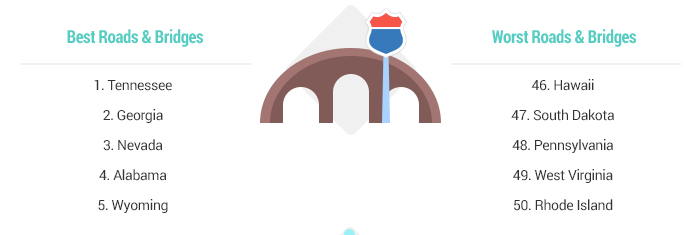
Personal finance outlet WalletHub released their study Wednesday titled “2022’s States with the Best and Worst Taxpayer ROI,” ranking taxpayer return on investment (ROI) based on the quality of services state residents received compared to their total state and local taxes. Georgia was recognized as one of the top five for “Best State for Taxpayer Return On Investment” and ranked second for Best Roads and Bridges.
| Taxpayer ROI* | State | Total Taxes Paid per Capita** | Overall Government Services |
|---|---|---|---|
| 1 | New Hampshire | 3 | 4 |
| 2 | Florida | 2 | 22 |
| 3 | South Dakota | 8 | 24 |
| 4 | Georgia | 6 | 30 |
| 5 | Virginia | 29 | 2 |
In a detailed breakdown by state, Georgia ranked 30 for Overall Government Services, 34 for Education, 40 for Health, 29 for Safety, 5 for Economy, 17 for Infrastructure & Pollution, and received an overall score of 52.17
“We know that when Georgians pay taxes, that is their money, and it should be spent to best reflect and serve their interests,” said Governor Brian Kemp. “I am proud our responsible, conservative approach to governing has led to the Peach State’s recognition as one of the best at returning taxpayers’ investment through crucial services like quality education, healthcare, and public safety. As good stewards of these dollars, we are also now in a position to put money back into the pockets of hardworking Georgians through a tax refund, a temporary gas tax halt, an income tax cut, and to further invest in education, healthcare, our military servicemembers, public safety, and more.”
“Of particular note was Georgia’s ranking as the No. 2 state for roads and bridges nationwide, further cementing the state’s reputation as an economic powerhouse capable of supporting a wide range of industries in every region. This reliable infrastructure network, along with a focus on quality schools, access to healthcare, and strong public safety, set Georgia apart as offering one of the biggest bangs for taxpayers’ bucks.”
WalletHub’s report contrasted state and local tax collections with the quality of the services residents receive in each of the 50 states within five categories: Education, Health, Safety, Economy, and Infrastructure & Pollution. These categories were analyzed first and then further broken down into 30 metrics that analyzed services like quality of school systems, quality of roads and bridges, average life expectancy, and violent crime rate, and then graded on a 100-point scale. They then determined each state’s weighted average across all 30 metrics to calculate its “Overall Government Services Score.”
Lastly, they constructed the Taxpayer ROI ranking by comparing each state’s “Overall Government Services Score” to its “Total Taxes Paid per Capita.”
Visit WalletHub HERE to see the full report.


Chattooga Opinions
Medically Supervised Weight Loss: Inside Premier Weight Loss & Medispa

Chattooga Local News
Georgia Power Files Plan for Customer Rate Decrease with Public Service Commission

Chattooga Local Government
Carr Pushes for Permanent Halt of Medicare and Medicaid Funding for Child Sex-Change Procedures

Bulloch Public Safety
02/20/2026 Booking Report for Bulloch County

Bulloch Public Safety
01/26/2026 Booking Report for Bulloch County

Bulloch Public Safety
02/09/2026 Booking Report for Bulloch County

Bulloch Public Safety
02/16/2026 Booking Report for Bulloch County

Bulloch Public Safety
02/02/2026 Booking Report for Bulloch County

Bulloch Public Safety
01/30/2026 Booking Report for Bulloch County


