The U.S. Department of Transportation (DOT) recently released its May 2019 Air Travel Consumer Report (ATCR) on reporting marketing and operating air carrier data compiled for the month of March 2019. The full consumer report and other aviation consumer matters of interest to the public can be found at http://www.transportation.gov/airconsumer.

March On-Time Performance
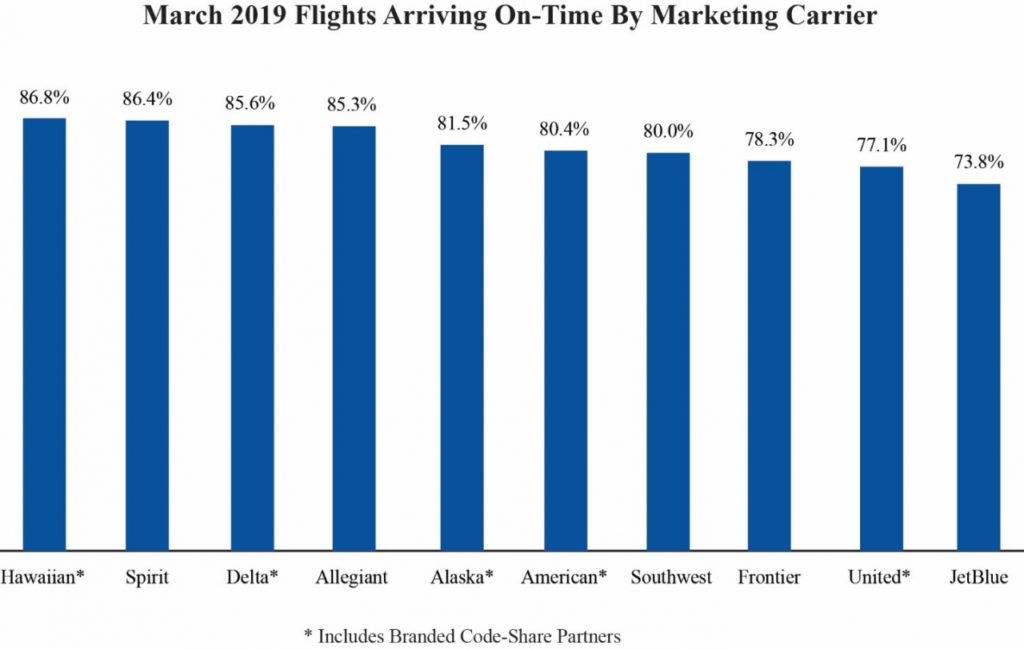
In March 2019, reporting marketing carriers posted an on-time arrival rate of 80.9%, up from both the 73.8% on-time rate in February 2019 and from 80.7% in March 2018.
Highest Reporting Marketing Carrier On-Time Arrival Rates (ATCR Table 1)
- Hawaiian Airlines Network – 86.8%
- Spirit Airlines – 86.4%
- Delta Airlines Network – 85.6%
Lowest Reporting Marketing Carrier On-Time Arrival Rates (ATCR Table 1)
- JetBlue Airways – 73.8%
- United Airlines Network – 77.1%
- Frontier Airlines – 78.3%
March Cancellations
In March 2019, reporting marketing carriers canceled 2.0% of their scheduled domestic flights, down from both the rate of 3.1% in February 2019 and 2.9% in March 2018.
Lowest Reporting Marketing Carrier Rates of Canceled Flights (ATCR Table 6)
- Hawaiian Airlines Network – 0.3%
- Delta Airlines Network – 0.3%
- Allegiant Airlines – 0.4%
Highest Reporting Marketing Carrier Rates of Canceled Flights (ATCR Table 6)
- Southwest Airlines – 4.4%
- United Airlines Network – 2.4%
- American Airlines Network – 1.9%
Tarmac Delays
In March 2019, airlines reported five tarmac delays of more than three hours on domestic flights, compared to 16 such tarmac delays reported in February 2019 and one tarmac delay reported in March 2018. In March 2019, airlines reported three tarmac delays of more than four hours on international flights, compared to no tarmac delays reported in February 2019 and no tarmac delays reported in March 2018. Extended tarmac delays are investigated by the Department.
Domestic Flights with Longest Tarmac Delays Exceeding Three Hours (ATCR Table 8)
- United Airlines flight 1748 from Dallas-Fort Worth to Newark, N.J., 3/15/19 – delayed 3 hours and 39 minutes on the tarmac at Newburgh, NY after being diverted
- Delta Air Lines flight 1819 from New York LaGuardia to Denver, 3/13/19 – delayed 3 hours and 30 minutes on the tarmac at Denver
- United Airlines flight 2006 from Newark, N.J. to San Francisco, 3/3/19 – delayed 3 hours and 13 minutes on the tarmac at Newark
International Flights with Longest Tarmac Delays Exceeding Four Hours (ATCR Table 8A)
- Air China flight 982 from New York JFK to Beijing, 3/15/19 – delayed 4 hours and 42 minutes on the tarmac at New York JFK
- United Airlines flight 14 from Newark, N.J. to London Heathrow, 3/15/19 – delayed 4 hours and 13 minutes on the tarmac at Newark
- British Airways flight 114 from New York JFK to London Heathrow, 3/3/19 – delayed 4 hours and 10 minutes on the tarmac at New York JFK
Mishandled Baggage
Beginning in 2019, airlines with at least one-half of 1% of the total scheduled-service domestic passenger revenue for the 12-months ending December 2018 are required to report mishandled baggage data for domestic flights. Mishandled baggage data is to consist of the number of mishandled bags and the number of checked bags. Previous reports were the number of mishandled baggage reports and passenger enplanements. The Department decided to delay the publication in the ATCR of the new mishandled baggage data to enable the Department and airlines to ensure the accuracy of the data, which will allow consumers to make informed choices. Inaccurate data is of little use to consumers.
The Department is today publishing March 2019 mishandled baggage data in the May 2019 Air Travel Consumer Report. The Department has also updated the ATCRs for February 2019 (December 2018 data), March 2019 (January 2019 data), and April 2019 (February 2019 data) to include the new mishandled baggage data. All of the reports can be found at Air Travel Consumer Report.
In March 2019, the reporting marketing carriers posted a mishandled baggage rate of 5.24 mishandled bags per 1,000 checked bags, a lower rate than February 2019’s rate of 6.03 per 1,000 checked bags. For the first quarter of 2019, the carriers posted a mishandled baggage rate of 5.67 mishandled bags per 1,000 checked bags.
Mishandled Wheelchairs and Scooters
In March 2019, reporting marketing airlines reported checking 44,051 wheelchairs and scooters and mishandling 759, a rate of 1.72% mishandled, compared to a rate of 1.70% mishandled in February 2019. For the first quarter of 2019, the carriers posted a mishandled wheelchair and scooter rate of 1.82%. In December 2018, DOT reported mishandled wheelchairs and scooters data for carriers for the first time. See the May 2019 Air Travel Consumer Report for mishandled wheelchair and scooter numbers by airline.
Bumping/Oversales
Bumping/oversales data, unlike other air carrier data, are reported quarterly rather than monthly. For the first quarter of 2019, the 10 U.S. reporting marketing carriers posted an involuntary denied boarding, or bumping, rate of 0.32 per 10,000 passengers, higher than both the rate of 0.19 for the fourth quarter of 2018 and the rate of 0.15 in the first quarter of 2018.
See pages 40-43 of the May 2019 Air Travel Consumer Report for denied boarding numbers by airline.
Incidents Involving Animals
In March 2019, U.S. airlines reported one incident involving the death, injury, or loss of an animal while traveling by air, down from the three reports filed in March 2018, but up from the zero reports in February 2019. March’s incident involved the death of one animal.
Complaints About Airline Service
In March 2019, DOT received 1,136 complaints about airline service from consumers, down 4.8 % from the total of 1,193 filed in March 2018 and up 6.5% from the 1,067 received in February 2019. For the first quarter of this year, the Department received 3,083 complaints, down 16.5 percent from the 3,692 filed during the first quarter of 2018.
Complaints About Treatment of Disabled Passengers
In March 2019, the Department received a total of 59 disability-related complaints, down from the 60 complaints received in March 2018 and equal to the 59 complaints received in February 2019. For the first quarter of this year, the Department received 168 disability-related complaints, down from the total of 179 filed during the first quarter of 2018. All complaints alleging discrimination on the basis of disability are investigated.
Complaints About Discrimination
In March 2019, the Department received six complaints alleging discrimination – all regarding race. This is down from the total of 10 complaints recorded in March 2018 and the 14 complaints in February 2019. For the first quarter of this year, the Department received 27 discrimination complaints – 19 complaints regarding race, one complaint regarding national origin, three complaints regarding color, three complaints regarding religion, and one complaint categorized as “other.” This is up from the total of 22 filed during the first quarter of 2018. All complaints alleging discrimination are investigated to determine if there has been a violation(s) of the passenger’s civil rights.


Chattooga Local News
AdventHealth Redmond to Offer $30 Mammograms in May

Chattooga Local Government
Probate Judge Gary Woods Issues Reminder on Polling Place Laws

Chattooga Public Safety
Most Recent Chattooga County Food Service Inspections

Chattooga Local Government
INSIDER: Candidates for Chattooga County Sole Commissioner

Bulloch Public Safety
GDOT: Traffic Impacts for the I-16 at I-95 Improvement Projects Through April 27

Bulloch Public Safety
03/25/2024 Booking Report for Bulloch County
Bulloch Public Safety
04/09/2024 Booking Report for Bulloch County
Bulloch Public Safety
04/01/2024 Booking Report for Bulloch County
Bulloch Public Safety
04/08/2024 Booking Report for Bulloch County
Bulloch Public Safety
04/15/2024 Booking Report for Bulloch County